
The DSTV Premiership was back over the weekend with plenty of top-class football action happening right across the country. After a low scoring 2021/22 campaign, it was great to have a big game to begin the weekend – featuring defending champions Mamelodi Sundowns and 2021/22 runners-up Cape Town City which finished 2-0. Elsewhere Orlando Pirates won the original Soweto derby 1-0 against Swallows FC, whilst Kaizer Chiefs lost away to Royal AM on match day 1. This season, Laduma Analytics will bring you a ‘By the numbers’ breakdown of games.
Cape Town City FC v Mamelodi Sundowns
The 2022/23 season opener was an eagerly awaited game for many and most definitely did not disappoint. Both teams had significant changes to their starting line-up with Eric Tinkler having to settle for Mokeke and Cupido in central defence over the regular pairing of Fielies and Fasika last term. Elsewhere, debutants Marc van Heerden and Luke Daniels were thrown straight into the mix for the Citizens. For the champions, Aubrey Modiba was preferred over Lyle Lakay at left-back and Bafana Bafana international goalkeeper Ronwen Williams made his debut in goal for Masandawana.
Main Stats
In many statistical measures, this was a close game. Both teams were equally matched across a broad range of statistical numbers with the difference ultimately coming down to individual quality. Despite having the same number of shots, the hosts created a lot more quality chances (xG) but failed to convert them when it came down to it.
13 – the number of shots taken by both
teams during the game, yet only 3 each hit the target.
8 – shots wide for the hosts and 5 for the visitors.

Goal Scored
1 – The two goals that separated the sides were pure magic and could in all honesty have rivalled each other for goal of the match. First off, Aubrey Modiba converted a fabulous free-kick effort that dipped perfectly over the CT City wall and went sailing past goalkeeper Hugo Marques.
2 – The second goal showed the brilliance of Sundowns – the vision of passer and recipient to see space in behind the backline of the Citizens and Themba Zwane to place the ball past Marques.
Possession
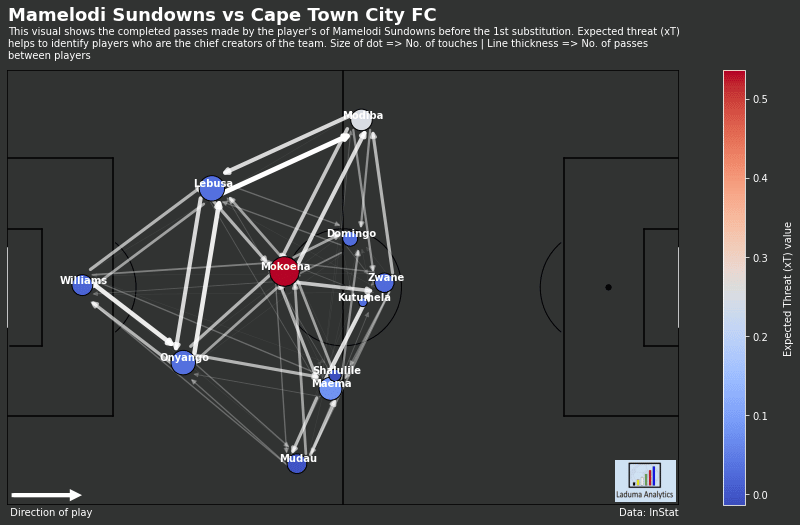
53% – From a possession perspective, Sundowns dominated the ball which was evident from the starting whistle. Every individual was adamant to secure possession of the ball and force the hosts into playing on the back foot. Displaying how dominant Sundowns were we can use a passing network to visualise how often each player played passed between each other. The visual below shows in detail how the passing connections were amongst the entire squad before the first substitution happened after 70 minutes.
Defensively
Cape Town City had their fair share of defensive duels and matched their opponents quite close across tackles (38 to 31) and ball interceptions (40 to 42). Where they were outclassed was on the pressing side – Passes per defensive actions (PPDA). Sundowns managed to allow the hosts on average no more than 4 passes before making a defensive action, while CT City sat back and gave Masandawana at least 7 passes before attempting to regain the ball.
Match 2: Orlando Pirates v Swallows FC
For 60 minutes, the original Soweto derby was mostly one-way traffic – with the Bucs in control. Having said that, Pirates were more possessive of the ball for the majority of the game and then gradually allowed Swallows back into the game. It was then that the game became a proper derby with stoppages of play via scrappy tackles. The whole Pirates team can be very thankful to Richard Ofori for the clean sheet at the end of 90 minutes.
Shots
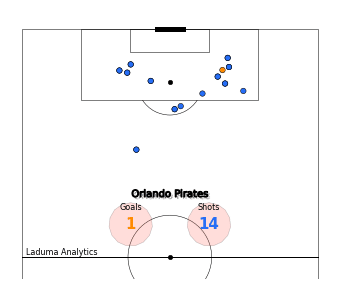
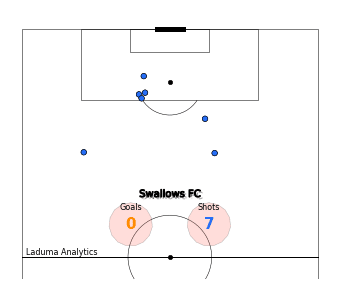
14 – the number of shots taken by Pirates in their first league game of the season vs Swallows (7)
5 – the number of shots on target by Pirates vs Swallows (2)
As shown by the shot map below, Pirates got into very good positions to pull the trigger and could easily have scored more than one goal. Swallows on the other hand had chances fair and few between but could have come away with a draw – especially the group of shots in the 2nd half just inside the box.
xG
1.21 – The Bucs were a slightly better attacking side in the 1st half (0.70) compared to the 2nd half (0.51) based on their xG quality from Saturday’s game.
0.36 – Swallows managed just 0.36 xG for the entire match.
With all the attacking threat and ball possession it was no wonder Pirates beat their opponents to more entrances into the opposition box
18 – Pirates entries into the opposition box
11 – Swallows entries into the opposition box
Attack Channels
25 – The left flank of Pirates was slightly more sought after for attacks in comparison to the centre channel (19) and the right channel (23 attacks). This would come as little surprise to anyone who knows Pirates, especially with Hotto being one of Pirates’ most creative players on the left.
29 – Swallows on the other hand favoured the right-hand side (29 attacks) slightly more than the left (26) and like Pirates down the middle the least of all three options.
Defensively
4.1 – Where Pirates were again superior to Swallows came when we look at PPDA – Passes per defensive actions (PPDA). The Bucs managed to allow the hosts on average no more than 4.1 passes before making a defensive action, while Swallows sat back and allowed at least 8 passes before attempting to regain the ball.
Match 3: Royal AM v Kaizer Chiefs
Shots
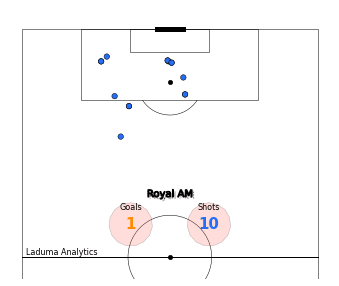
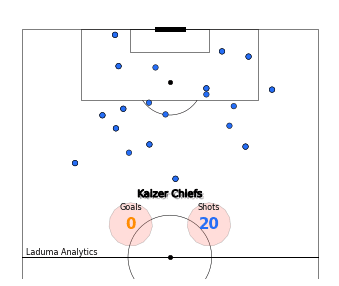
20 – Kaizer Chiefs (at the time of writing) had managed the highest shot count of match day 1. Their opponents on the day managed just half that total. For all their efforts, 12 shots came from outside the box – an area known for low conversion%. It’s important to note they also trailed in the 1st minute, so chasing a game for 90 minutes may influence the shot count.
xG
1.76 – Despite having less shots than AmaKhosi, the hosts managed to create nearly 2 goals worth of chances to finish match day 1 as the most dangerous side. Chiefs on the other hand managed to create, 1.29 xG, itself not a terrible sum of quality but not great off 20 attempts at goal. Yet, their shots were mostly out of desperation as Royal AM sat back to defend their early lead.
Possession
57% possession to Chiefs versus 43% to Royal AM
526 – the number of passes that Chiefs attempted compared to Royal AM’s 385.
86% – the passing accuracy rate of Chiefs vs 79% for Royal AM.
Flanks of Attack
Both teams had different strategies to attack each other yet one flank saw more action than the other.

Defensive Activity
Both were closely matched when we look at PPDA: Chiefs allowing 6 passes per a defensive action compared to 5.1 from the hosts. Again, this was an unusual game given the 1st-minute goal.


